Hali ya hewaRain and temperature, seven places
Masai Mara weather by month
Masai Mara weather changes little in temperature and a lot in rain. At Keekorok, in the south-east of the reserve in Masai Mara, Kenya, the mean daily high runs 25 to 30 °C (77 to 86 °F) over the year and the mean daily low 13 to 16 °C. The rain is what moves: a monthly mean of 35 mm in July against 160 mm in April, with rain on 3 days in an average July and 10 days in April. Of seven places across the Mara, Mara North Conservancy gets the most in a year and Naboisho Conservancy the least.
Photo: Wajahat Mahmood / Wikimedia Commons, CC BY-SA 2.0

Some links on this page are affiliate links: the guide earns a commission when you book through them. The partner sets the price; the guide adds no fee.
All figures here are 30-year means for 1991 to 2020, so any one year can sit well off them; the range beside each mean shows how far. Rain comes from CHIRPS, a satellite estimate calibrated with rain gauges on a fine grid (Climate Hazards Center). Temperature comes from NASA POWER, a reanalysis: a weather model run over past observations, on a grid cell about 50 km (31 mi) wide (NASA POWER). Neither is a weather station at a camp. Which month suits your trip, with the herds and the fees, is on the best time to visit the Masai Mara; this page gives the weather behind it.
Once you know your month, a three-day group joining safari to the Masai Mara in a Land Cruiser jeep is one way to go; check whether its price includes the reserve fee for that month.
MweziChoose a place, then a month
Rain and temperature, month by month
Pick one of seven places for its year: the bar is the mean rain for each month, the whisker the range the monthly total fell in for 8 years in 10, and at Keekorok and Mara North the two lines are the mean daily high and low. The table under the chart has every value, including the share of days with less than 1 mm of rain.
Below it, choose a month to set the seven places side by side. The places run from the Mara Triangle in the west to the conservancies in the east; the map in the next section shows where each one lies.
Mara Serena (Mara Triangle) 1,055 mm a year, 875 to 1,240 mm in 8 years of 10
| Month | Mean rain | 8 years in 10 | Rain days | Days under 1 mm |
|---|---|---|---|---|
| January | 80 mm | 25 to 140 mm | 9 days | 71% |
| February | 75 mm | 40 to 130 mm | 8 days | 71% |
| March | 130 mm | 80 to 190 mm | 12 days | 63% |
| April | 155 mm | 90 to 260 mm | 13 days | 57% |
| May | 95 mm | 60 to 135 mm | 8 days | 73% |
| June | 70 mm | 35 to 115 mm | 5 days | 83% |
| July | 30 mm | 15 to 45 mm | 4 days | 89% |
| August | 85 mm | 50 to 135 mm | 5 days | 83% |
| September | 55 mm | 25 to 90 mm | 7 days | 77% |
| October | 50 mm | 25 to 75 mm | 9 days | 72% |
| November | 110 mm | 60 to 175 mm | 12 days | 61% |
| December | 115 mm | 55 to 185 mm | 10 days | 69% |
Musiara 1,055 mm a year, 870 to 1,245 mm in 8 years of 10
| Month | Mean rain | 8 years in 10 | Rain days | Days under 1 mm |
|---|---|---|---|---|
| January | 80 mm | 25 to 150 mm | 9 days | 70% |
| February | 75 mm | 40 to 130 mm | 8 days | 72% |
| March | 135 mm | 85 to 210 mm | 12 days | 63% |
| April | 150 mm | 80 to 245 mm | 13 days | 58% |
| May | 95 mm | 60 to 130 mm | 8 days | 74% |
| June | 75 mm | 45 to 125 mm | 5 days | 83% |
| July | 35 mm | 20 to 55 mm | 3 days | 89% |
| August | 80 mm | 50 to 120 mm | 5 days | 84% |
| September | 60 mm | 25 to 95 mm | 7 days | 78% |
| October | 55 mm | 25 to 80 mm | 8 days | 73% |
| November | 95 mm | 55 to 135 mm | 11 days | 64% |
| December | 120 mm | 60 to 210 mm | 9 days | 70% |
Mara North Conservancy 1,070 mm a year, 865 to 1,245 mm in 8 years of 10
| Month | Mean rain | 8 years in 10 | Rain days | Days under 1 mm | Daily high | Daily low |
|---|---|---|---|---|---|---|
| January | 80 mm | 20 to 150 mm | 9 days | 70% | 27 °C (81 °F) | 14 °C (57 °F) |
| February | 75 mm | 40 to 135 mm | 8 days | 72% | 28 °C | 14 °C |
| March | 140 mm | 85 to 215 mm | 11 days | 64% | 28 °C | 15 °C |
| April | 160 mm | 85 to 275 mm | 13 days | 58% | 26 °C | 15 °C |
| May | 95 mm | 55 to 130 mm | 8 days | 74% | 24 °C | 14 °C |
| June | 75 mm | 40 to 105 mm | 6 days | 81% | 23 °C | 13 °C |
| July | 35 mm | 20 to 50 mm | 4 days | 89% | 24 °C | 12 °C |
| August | 80 mm | 50 to 125 mm | 5 days | 83% | 25 °C | 13 °C |
| September | 60 mm | 25 to 95 mm | 6 days | 79% | 26 °C | 13 °C |
| October | 45 mm | 25 to 70 mm | 8 days | 74% | 27 °C | 14 °C |
| November | 100 mm | 65 to 145 mm | 11 days | 64% | 26 °C | 14 °C |
| December | 120 mm | 60 to 195 mm | 9 days | 72% | 26 °C | 14 °C |
Talek Gate 880 mm a year, 720 to 1,090 mm in 8 years of 10
| Month | Mean rain | 8 years in 10 | Rain days | Days under 1 mm |
|---|---|---|---|---|
| January | 75 mm | 20 to 125 mm | 7 days | 78% |
| February | 65 mm | 40 to 110 mm | 7 days | 76% |
| March | 125 mm | 60 to 190 mm | 9 days | 71% |
| April | 140 mm | 80 to 240 mm | 10 days | 68% |
| May | 70 mm | 40 to 100 mm | 6 days | 80% |
| June | 55 mm | 30 to 105 mm | 4 days | 86% |
| July | 35 mm | 20 to 45 mm | 3 days | 90% |
| August | 60 mm | 30 to 95 mm | 4 days | 87% |
| September | 45 mm | 20 to 70 mm | 4 days | 86% |
| October | 30 mm | 15 to 45 mm | 6 days | 82% |
| November | 80 mm | 45 to 125 mm | 9 days | 71% |
| December | 105 mm | 40 to 195 mm | 7 days | 78% |
Keekorok 955 mm a year, 795 to 1,165 mm in 8 years of 10
| Month | Mean rain | 8 years in 10 | Rain days | Days under 1 mm | Daily high | Daily low |
|---|---|---|---|---|---|---|
| January | 75 mm | 25 to 120 mm | 7 days | 77% | 28 °C (82 °F) | 15 °C (59 °F) |
| February | 70 mm | 40 to 115 mm | 7 days | 76% | 30 °C | 15 °C |
| March | 125 mm | 70 to 180 mm | 10 days | 68% | 29 °C | 16 °C |
| April | 160 mm | 85 to 290 mm | 10 days | 68% | 27 °C | 15 °C |
| May | 80 mm | 45 to 120 mm | 6 days | 79% | 25 °C | 15 °C |
| June | 65 mm | 35 to 105 mm | 5 days | 85% | 26 °C | 14 °C |
| July | 35 mm | 20 to 55 mm | 3 days | 89% | 27 °C | 13 °C |
| August | 60 mm | 35 to 95 mm | 4 days | 88% | 28 °C | 14 °C |
| September | 45 mm | 20 to 70 mm | 4 days | 86% | 29 °C | 14 °C |
| October | 45 mm | 20 to 70 mm | 6 days | 82% | 30 °C | 15 °C |
| November | 95 mm | 55 to 140 mm | 8 days | 73% | 28 °C | 15 °C |
| December | 105 mm | 45 to 210 mm | 7 days | 78% | 28 °C | 15 °C |
Sekenani Gate 905 mm a year, 745 to 1,120 mm in 8 years of 10
| Month | Mean rain | 8 years in 10 | Rain days | Days under 1 mm |
|---|---|---|---|---|
| January | 75 mm | 30 to 125 mm | 7 days | 79% |
| February | 70 mm | 35 to 115 mm | 6 days | 78% |
| March | 115 mm | 70 to 185 mm | 8 days | 74% |
| April | 160 mm | 75 to 275 mm | 9 days | 71% |
| May | 70 mm | 35 to 110 mm | 5 days | 83% |
| June | 60 mm | 30 to 95 mm | 4 days | 86% |
| July | 35 mm | 15 to 50 mm | 3 days | 91% |
| August | 50 mm | 25 to 85 mm | 3 days | 90% |
| September | 45 mm | 20 to 65 mm | 4 days | 88% |
| October | 35 mm | 15 to 55 mm | 5 days | 85% |
| November | 85 mm | 50 to 135 mm | 7 days | 78% |
| December | 105 mm | 45 to 220 mm | 6 days | 82% |
Naboisho Conservancy 815 mm a year, 660 to 1,000 mm in 8 years of 10
| Month | Mean rain | 8 years in 10 | Rain days | Days under 1 mm |
|---|---|---|---|---|
| January | 70 mm | 20 to 125 mm | 7 days | 79% |
| February | 65 mm | 30 to 105 mm | 6 days | 78% |
| March | 110 mm | 65 to 175 mm | 8 days | 74% |
| April | 145 mm | 70 to 255 mm | 8 days | 73% |
| May | 65 mm | 30 to 100 mm | 6 days | 82% |
| June | 55 mm | 25 to 90 mm | 4 days | 87% |
| July | 30 mm | 15 to 40 mm | 3 days | 92% |
| August | 45 mm | 25 to 70 mm | 3 days | 90% |
| September | 35 mm | 15 to 60 mm | 3 days | 89% |
| October | 25 mm | 10 to 40 mm | 5 days | 85% |
| November | 75 mm | 45 to 120 mm | 7 days | 78% |
| December | 100 mm | 35 to 170 mm | 6 days | 82% |
MsimuReserve fee seasons, Narok County
The fee season is not the rain season. The low season holds the long rains and the wettest month at Keekorok, April; the driest month there, July, falls in the high season. Each fee is per person for a day ticket valid 6:00 to 18:00, whatever time you enter.
One month, seven places
In April, west to east. The wettest of the seven: Mara North Conservancy, Keekorok and Sekenani Gate. The driest: Talek Gate. The other pages of this guide quote Keekorok.
- Mara Serena (Mara Triangle)Mara Triangle 155 mm 90 to 260 mm in 8 years of 10 13 days with rain
- Musiarareserve, Narok side 150 mm 80 to 245 mm in 8 years of 10 13 days with rain
- Mara North Conservancyconservancy 160 mm 85 to 275 mm in 8 years of 10 13 days with rain
- Talek Gatereserve gate, Narok side 140 mm 80 to 240 mm in 8 years of 10 10 days with rain
- Keekorokreserve, Narok side 160 mm 85 to 290 mm in 8 years of 10 10 days with rain
- Sekenani Gatereserve gate, Narok side 160 mm 75 to 275 mm in 8 years of 10 9 days with rain
- Naboisho Conservancyconservancy 145 mm 70 to 255 mm in 8 years of 10 8 days with rain
Rain: satellite and gauge rainfall estimate on a 0.05 degree grid (CHIRPS v2.0, UCSB Climate Hazards Center), 1991 to 2020, not a rain gauge at the place. A rain day has 1 mm or more. Temperature: NASA POWER daily data (MERRA-2 reanalysis, a grid cell about 50 km (31 mi) wide), 1991 to 2020, for Keekorok and Mara North only. Bars and whiskers share one scale on every place.
RamaniSeven places, one record
Where it rains more in the Masai Mara
The north and west of the Mara get more rain than the south and east. In the 30-year satellite record, Mara North Conservancy has a mean of 1,070 mm a year, Musiara 1,055 mm and Mara Serena in the Triangle 1,055 mm. Keekorok, in the south-east of the reserve, has 955 mm, Talek Gate 880 mm, Sekenani Gate 905 mm and Naboisho Conservancy in the east 815 mm.
Kenya's 2010 UNESCO tentative-list entry describes the same slope in round numbers: about 800 mm a year in the drier east to about 1,200 mm a year in the wetter west (UNESCO). The entry gives the general picture; the seven points give the mean at each place.
Single years swing widely. At Keekorok the yearly total ranged from 795 to 1,165 mm in 8 years of 10; at Mara Serena from 875 to 1,240 mm. The Mara Conservancy, which runs the Triangle, reports its own rain total of 1,111.87 mm for 2023 (monthly report): one year, inside that range.
Across the border, Tanzania National Parks gives the Serengeti in Tanzania an annual average of 900 to 1,000 mm, with a rain season from November to April (TANAPA brochure). The same satellite record has a mean of 830 mm at Seronera. The two parks side by side: Masai Mara vs Serengeti.
The gap matters most where you sleep. The wetter north and west hold the Mara Triangle and Mara North; the drier east holds Naboisho and its neighbors. Bases by area: where to stay in the Masai Mara.

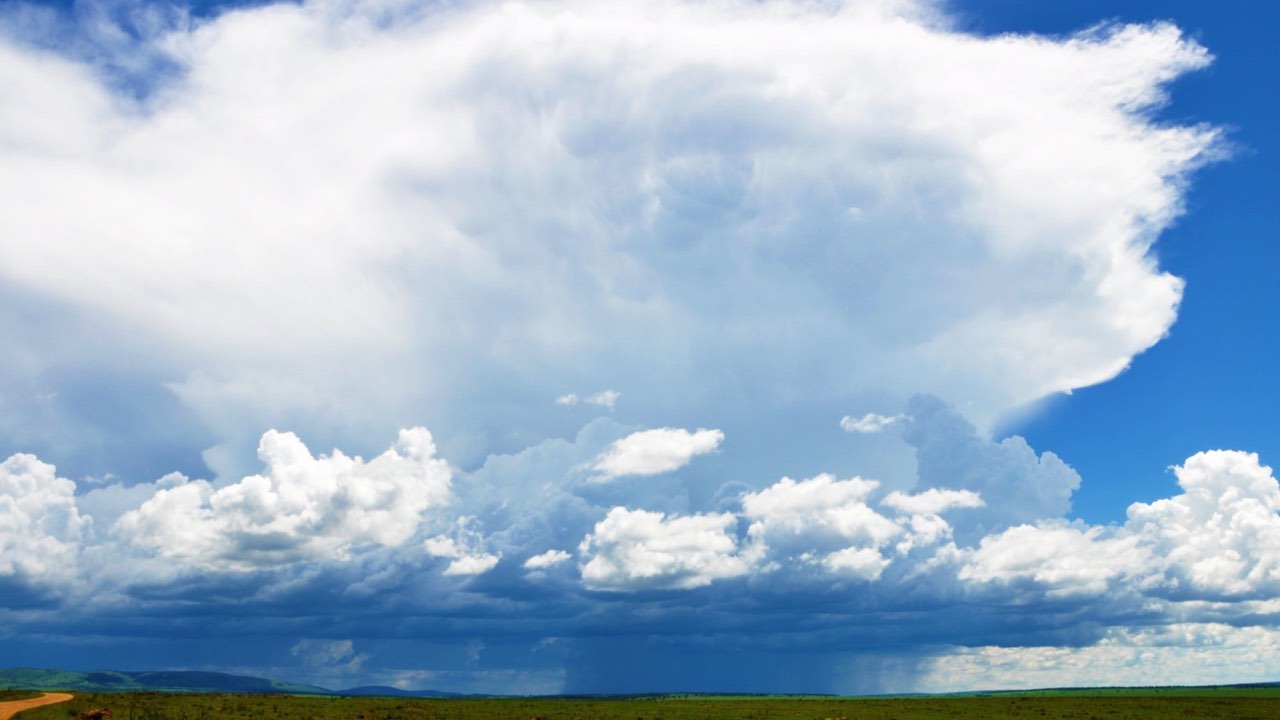
Photo: Markrosenrosen / Wikimedia Commons, CC BY-SA 4.0

MvuaStorm over the plains
Two rainy seasons, one dry stretch.
MvuaThe long rains and the short rains
The long rains and the short rains
The Mara has two rainy seasons. Kenya's 2023 UNESCO tentative-list entry describes long rains of about six to eight weeks in April and May and short rains of about four weeks in November and December (UNESCO). A study of Mara cheetahs by Broekhuis and Gopalaswamy (2016) draws the seasons wider: a wet season from November to June, with short rains in November and December and long rains from March to June, and a dry season from July to October (PLOS ONE).
The 30-year record sits between the two descriptions. At Keekorok the wettest month is April, with a mean of 160 mm; March has 125 mm and May falls back to 80 mm. The driest month at Keekorok is July, at 35 mm. In the east the low point comes later: at Naboisho the driest month is October, with 25 mm.
How many days it rains
A wet month is not wet every day. Even in April, Keekorok has rain (1 mm or more) on 10 days in an average year, and 68% of April days stay under that mark. In July it rains on 3 days, and 89% of days stay under it. The wetter west has more rain days: Mara Serena in the Triangle has 13 days in April.
The short rains swing most from year to year. In November, Keekorok's total ranged from 55 to 140 mm in 8 years of 10, and in December from 45 to 210 mm. Plan a November or December trip for some wet days without knowing how many.


JuaDays and nights
Warm days, cold mornings
25 to 30 °C (77 to 86 °F)Keekorok, mean daily high
13 to 16 °C (55 to 61 °F)Keekorok, mean daily low
23 to 28 °CMara North, mean daily high
12 to 15 °CMara North, mean daily low
The Mara sits close to the equator and high up. Broekhuis (2018) puts the study landscape of reserve and conservancies at about 1,700 m (5,577 ft) (Ecology and Evolution), a figure for the area, not for one camp. The height keeps the heat moderate and the nights cool, and the season changes them only a little.
At Keekorok the warmest afternoons come in February and October, with a mean daily high of 30 °C. At Mara North the mean daily high is 24 °C in July. The monthly figures for both places are in the table under the chart.
UsikuIs it cold at night?
Cold at night and on early drives
Nights are cool all year. The mean daily low at Keekorok is lowest in July, at 13 °C; at Mara North in July, at 12 °C. Morning game drives start early, since a reserve ticket is valid from 6:00 to 18:00 (the entrance fee page explains the ticket window), and an open vehicle adds the wind of driving to the cool air.
These are grid means for a cell about 50 km wide, not readings at a camp. Temperature figures here cover Keekorok and Mara North only.


Hali ya hewaWhat the figures mean for your bag
What to pack for rain and cold mornings
The full clothing list, colors and luggage: what to wear on safari in Kenya.
-
A warm layer for the mornings
With mean lows of 13 to 16 °C at Keekorok and 12 to 15 °C at Mara North, a fleece or light down jacket earns its place in every month, peeled off by mid-morning. A hat and thin gloves help on drives that start at 6:00.
-
A rain shell in the wet months
From March to May and in November and December, rain falls on more days; at Keekorok on 10 days in April and 8 days in November. A light waterproof jacket that packs small covers it. In July it rains on 3 days in an average year.
-
Sun cover for the afternoons
Mean highs of 25 to 30 °C at Keekorok, under an equatorial sun, call for a brimmed hat, sunglasses and long sleeves in thin fabric. The temperature swing between dawn and mid-afternoon is the reason to dress in layers.
BarabaraTracks, bridges and the rain
Roads and rivers after rain
Rain changes the roads more than the days. The US Department of State's Kenya travel information, dated 30 July 2026, says some unpaved roads are impassable in the rainy seasons, even for high-clearance four-wheel-drive vehicles, and advises against driving between cities at night (travel.state.gov). Times and the ways in from Nairobi are on Nairobi to Masai Mara.
Rivers rise with the rain, and bridges have gone with them. Narok County reported in November 2024 that the Mara Simba Bridge between Sekenani and Talek had been swept away by El Nino rains the year before (Narok County). In July 2024 the county commissioned the repaired Mara Bridge, damaged by the 2024 rains, which connects the reserve with the Mara Triangle side (Narok County). If you plan to cross between the Triangle and the Narok side in a wet month, ask your camp or driver which crossing is open that week.
For its own parks, the Kenya Wildlife Service says most park roads may need four-wheel drive in the long rains of April to June (KWS FAQ). That statement covers parks such as Amboseli and Lake Nakuru, not the Mara, which Narok County and the Mara Conservancy run. On a longer route, a Kenya safari itinerary lays out the drives between parks, and the Masai Mara itinerary the days inside the Mara.
Flying in avoids the long road; the airstrips and the schedules are on flights from Nairobi to the Masai Mara. What a wet-season trip costs against a dry-season one, with the lower park fee from January to June, is on Masai Mara safari cost.


MaswaliWeather questions
Masai Mara weather: questions
Herds by month: the Masai Mara migration. Where the Mara lies: where is the Masai Mara. All Masai Mara pages.
When should you avoid the Masai Mara?
No month is closed by weather, but the rain peaks in the long rains. At Keekorok the wettest month is April, with a mean of 160 mm and rain on 10 days. Unpaved roads can become impassable in the rainy seasons, as the US Department of State's Kenya travel information notes. The month choice with herds and fees: best time to visit.
Is now a good time to visit the Masai Mara?
Set the month chooser in the chart above to this month: it shows the mean rain, the range in 8 years of 10 and the rain days for seven places. Temperature changes little; the mean daily high at Keekorok runs 25 to 30 °C across the year. For the herds and the fee season in your month, use best time to visit the Masai Mara.
Is the Masai Mara cold at night?
Cool rather than cold. The mean daily low is 13 to 16 °C at Keekorok and 12 to 15 °C at Mara North across the year, lowest in July at Keekorok. The landscape lies at about 1,700 m. Bring a warm layer for nights and early drives in an open vehicle.
Which part of the Masai Mara gets the most rain?
The north and west. Of seven places in the 30-year satellite record, Mara North Conservancy has the highest yearly mean, 1,070 mm, and Naboisho Conservancy in the east the lowest, 815 mm. Mara Serena in the Mara Triangle has 1,055 mm. Any single year can sit far from these means.
Does it rain every day in the rainy season?
No. Even in April, the wettest month, Keekorok has rain (1 mm or more) on 10 days in an average year, and 68% of April days stay under that mark. In November it rains on 8 days. The wetter west has more rain days: Mara Serena in the Triangle has 13 days in April.
Sources
- Kenya's 2023 UNESCO tentative-list entry describes the long rains as about six to eight weeks in April and May and the short rains as about four weeks in November and December, with the Sand, Talek and Mara the reserve's main rivers. UNESCO World Heritage Centre: Tentative Lists, Maasai Mara Game Reserve (Ref. 6679), 2023-06-30.
- Kenya's 2010 UNESCO tentative-list entry gives a rainfall gradient across the Maasai Mara from about 800 mm a year in the drier east to about 1,200 mm a year in the wetter west. UNESCO World Heritage Centre: Tentative Lists, The African Great Rift Valley - The Maasai Mara (Ref. 5512), 2010-02-12.
- The Mara Conservancy reports its own rainfall totals for the Mara Triangle: 1,111.87 mm in 2023; over 900 mm by the end of August 2022 and nearly 1,000 mm by the end of September 2022 (that September's 67 mm measured at Serena); 1,026.5 mm by the end of September 2025; the reports do not name the gauge every time. Mara Conservancy: monthly report January 2024.
- Broekhuis 2018 locates the Maasai Mara study landscape at about 1°S, 35°E, elevation c. 1,700 m (approx. 2,600 km2 of reserve and conservancies). Broekhuis 2018, Ecology and Evolution 8: Natural and anthropogenic drivers of cub recruitment in a large carnivore (open-access full text on PubMed Central).
- Kenya Wildlife Service FAQ names two tourist seasons: high season July-December and December-March; low season April-June with long rains, when most park roads may need 4-wheel drive. Kenya Wildlife Service: FAQs, 2026-02-22.
- Keekorok, Maasai Mara National Reserve, satellite and gauge rainfall estimate 1991 to 2020: mean rainfall in January: 76 mm. CHIRPS v2.0 daily rainfall (UCSB Climate Hazards Center), 0.05 degree grid, 1991 to 2020, through NASA SERVIR ClimateSERV; own monthly statistics, 2026-11-12.
- Broekhuis & Gopalaswamy 2016 describe the Mara climate as bimodal: wet season November to June (short rains November-December, long rains March-June), dry season July to October; generally the migration reaches the northern Serengeti in July, spends August, September and October in the Maasai Mara and returns to Tanzania in November. Broekhuis & Gopalaswamy 2016, PLOS ONE 11(5) e0153875: Counting Cats: Spatially Explicit Population Estimates of Cheetah, 2016-05-02.
- The Mara Conservancy / KAPS ticket rate card, co-branded with Narok County Government, charges a non-resident adult the same park fee whether accommodated inside or outside the park: USD 200 per person per day from July to December. Mara Conservancy / KAPS: Park Fees Itemization rate card (Nature Paas ticket portal).
- The same co-branded rate card charges a non-resident adult USD 100 per person per day from January to June, whether accommodated inside or outside the park; non-resident children aged 9 to 17 and students in organized groups pay USD 50 per person per day in both blocks. Mara Conservancy / KAPS: Park Fees Itemization rate card (Nature Paas ticket portal).
- The Mara Conservancy ticket portal states that day tickets are valid 12 hours (6:00 to 18:00) and expire automatically at 6:00 pm, whatever time they are bought. Mara Conservancy / KAPS: Nature Paas ticket portal, 'Know Before You Go'.
- The Narok County Finance Act 2023 defines the Maasai Mara high season as 1 July to 31 December and the low season as 1 January to 30 June. Narok County Finance Act, 2023 (No. 3 of 2023), First Schedule: Maasai Mara National Reserve park fees and charges, 2023-10-13.
- Narok County: the Mara Bridge, repaired after 2024 rain damage, connects the Maasai Mara National Reserve with the Mara Triangle side (commissioned July 2024). Narok County Government: Three Water Projects and a Bridge Commissioned in Mara and Siana Wards, 2024-07-30.
- Narok County: the Mara Simba Bridge, which connects Sekenani and Talek across the Mara River, had been swept away by El Nino rains the year before (reported November 2024). Narok County Government: Siana Ward Development Tour, 2024-11-04.
- The US Department of State advises avoiding driving between cities at night (poor roads and lighting, banditry), notes traffic drives on the left, and says some unpaved roads are impassable in the rainy seasons even for high-clearance 4x4s. US Department of State: Kenya Travel Advisory and travel guidance, 2026-07-30.
- Tanzania National Parks: Serengeti's rain season runs November to April and dry season May to October; annual average rainfall 900 to 1,000 mm. Tanzania National Parks (TANAPA): Serengeti National Park Brochure - English (PDF, text read by OCR), 2025-07-22.
- Climate 1991 to 2020. Rain: CHIRPS v2.0 daily rainfall, UCSB Climate Hazards Center, 1991 to 2020 (satellite and gauge grid); temperature: NASA POWER daily point data (MERRA-2 reanalysis), 1991 to 2020; monthly means and the 8-of-10-years range computed from the daily series
- Unit conversions. Metric figures with US equivalents (1 km = 0.621371 mi, 1 m = 3.28084 ft, 1 kg = 2.20462 lb, 1 ft = 0.3048 m, 1 acre = 0.404686 ha, °F = °C × 9/5 + 32)